FII and DII Movements Explained: How Smart Money Shapes the Market (2)
- Details
In March 2026, two records were broken on the same day. Foreign investors pulled out Rs 1,22,540 crore from Indian stocks, one of the largest monthly foreign exits in decades. In the same month, domestic investors bought Rs 1,42,960 crore, also a record. Domestic buyers actually outweighed foreign sellers.
The Nifty still fell 11.3% that month. Then in April 2026, FPIs continued selling, Rs 70,135 crore more. And yet Nifty gained 7.5% that month.
If that seems contradictory, it's because most investors don't fully understand how FII and DII money works, what drives each, and why sentiment and arithmetic don't always tell the same story. This piece explains all of it.
FIIs, FPIs, DIIs: Let's Sort the Labels First
Let's clear up a common source of confusion first. FII and FPI are not the same thing, even though you'll see them used interchangeably in almost every news report.
"FPI" (Foreign Portfolio Investor) is the legally valid term today. SEBI introduced the FPI framework in 2014, merging three older categories into one: the older FII (Foreign Institutional Investor), Sub-Accounts, and Qualified Foreign Investors. FPI is a broader umbrella. It covers not just large institutions but also smaller foreign funds, family offices, and individual foreign investors.
FII (Foreign Institutional Investor) was an older, narrower category that covered only large institutional investors like pension funds, mutual funds, insurance companies, investment banks, and hedge funds. FII as a separate legal category no longer exists. All erstwhile FIIs were converted to FPIs. However, NSE and BSE still use the label 'FII/FPI' in their daily participant-wise trading reports, which is why you still see 'FII' in newspaper headlines.As of March 2026, foreign investors (FPIs) held just about 16.9% of the free-float market cap of NSE-listed companies. That’s down from 17.4% in December 2024 and marks a 15-year low, thanks to continuous selling pressure throughout FY26.
On the other hand, domestic institutions (DIIs) have steadily increased their stake to a record 19.24% in the March 2026 quarter, up from 18.72% in December 2025. The gap between the two has widened quite a bit, remember in June 2025 it was around 19.2% for DIIs versus 18.5% for FPIs. That structural shift we spotted back then has only become stronger.
DII numbers come from NSDL and AMFI monthly reports, while the FPI ownership figures are based on NSE’s India Ownership Tracker reports and research that draws from the same official data.
Two Years of Data: The Pattern That Explains Everything
Before the mechanics, look at the actual numbers. Every figure below comes from NSDL and AMFI official data. The April 2026 row now reflects the final month-end figure, not provisional mid-month data.
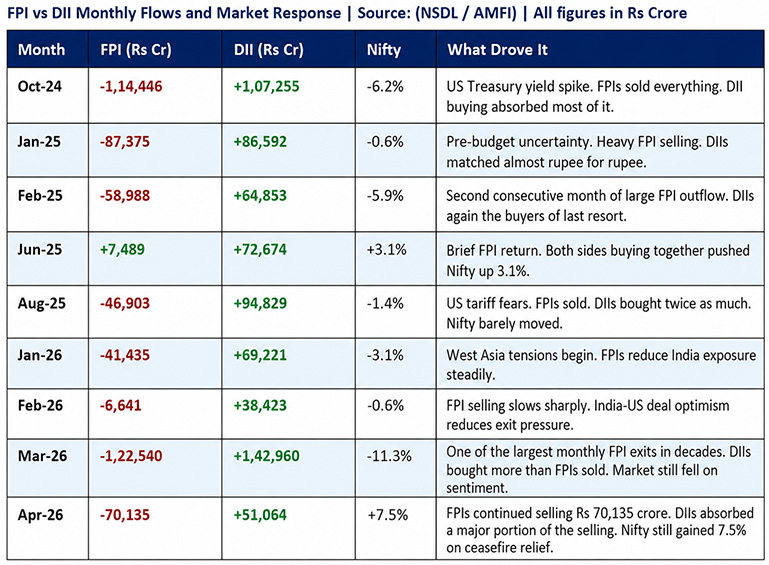
Step back and look at the full 25 months from April 2024 to April 2026. FPIs were net sellers in 18 of those 25 months. Their total net outflow across the period was Rs 7.84 lakh crore. DIIs, meanwhile, were consistent net buyers across all 25 months. Their total net inflow was Rs 14.98 lakh crore, nearly double the FPI outflow. For every rupee FPIs pulled out, domestic investors put in roughly Rs 1.91.
The table also shows something less obvious. The Nifty's direction is not simply determined by who wins the number battle. In April 2026, FPIs sold Rs 70,135 crore and Nifty still gained 7.5% because sentiment shifted with the ceasefire. In February and March 2025, DIIs outbought FPIs significantly, yet Nifty was down both months because global risk appetite was weak. Flows matter. Sentiment overrides them in the short term.
Why FII Selling Moves Markets So Fast
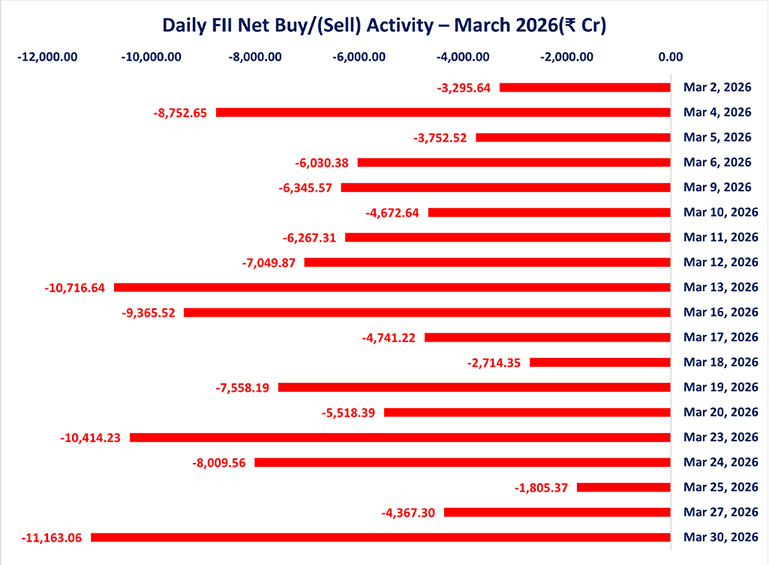
Speed is the key. A large FPI institution can decide at 9:30 AM to exit and finish selling thousands of crores by 3:30 PM. The selling is concentrated in large, liquid stocks. In March 2026, foreign investors were net sellers on almost every trading day of the month.
Three things typically trigger a big FPI exit. First, when US bond yields rise, safer dollar assets become more attractive than emerging markets like India. The spread between Indian 10-year G-sec yields and US 10-year Treasury yields compressed from a healthy 4% to just 1.8% in 2025, reducing India's yield appeal significantly. Second, when the rupee weakens, FPIs lose money on currency conversion before their stocks even move. A fund that entered India at Rs 82 per dollar and exits at Rs 95 has already lost around 16% just on exchange rates (if unhedged). Third, geopolitical shocks trigger broad risk-off selling across all emerging markets at once.
In March 2026, all three triggers, rising US bond yields, rupee weakness, and escalating West Asia geopolitical tensions, fired simultaneously. Foreign funds went beyond cash market selling and took aggressive derivative positions, heavily betting on further downside. This concentrated pressure hit banking stocks hardest, Bank Nifty crashed nearly 16.9% in March compared to the Nifty’s 11.3% decline. Market fear peaked, with the India VIX surging to a four-year high of 27.89.
Why DII Money Keeps Coming In, Month After Month
DIIs don't react to breaking news. That's the whole point.
When 9.72 crore people have active SIPs, that money leaves their bank accounts on a fixed date every month regardless of what the Nifty is doing. In March 2026, as FPIs were in full flight, SIP contributions reached Rs 32,087 crore, up 7.5% from February. People weren't calm. Their bank mandates ran automatically. That distinction matters enormously.
Insurance premiums work the same way. LIC deploys a portion of every premium into equities. EPFO puts provident fund contributions into equity index ETFs on a predetermined schedule. In calendar year 2025, DIIs invested a record Rs 6 lakh crore in Indian equities. FPIs withdrew Rs 2.03 lakh crore in the same period. DIIs didn't just offset the selling, they tripled it in absolute terms.
Why Every Successive Crash Has Hurt Less
For most of India's stock market history, FPIs set the tone. When they bought, Nifty went up. When they sold, it fell hard. Domestic institutions were simply too small to push back.
That has structurally changed. The crisis comparison below makes this visible.
How the DII Cushion Has Grown Across Every Major Market Event | Sources: NSDL, AMFI, NSE Historical Data
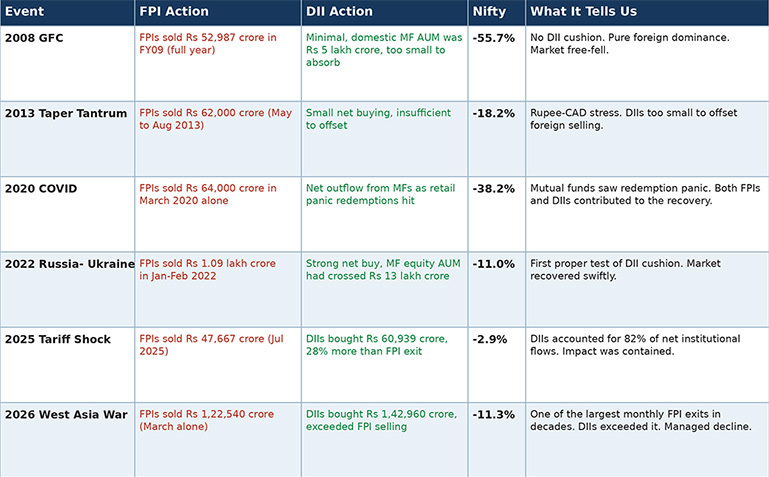
The progression is clear. In 2008, serious FPI selling caused a 55.7% crash with no DII cushion. In 2026, one of the largest monthly FPI exits in decades caused an 11.3% correction. That difference is explained entirely by DII capacity growing faster than FPI selling pressure over 18 years.
The underlying driver is a generational shift in how India saves. Equities and mutual funds made up just 2% of Indian household financial savings in FY12. By FY25, that figure had risen to 15.2%, a sevenfold jump, confirmed by the Economic Survey 2025-26. Demat accounts grew from 4 crore in 2020 to 21.6 crore by December 2025. More than 56% of newly registered investors are under age 30. India's households are structurally moving from bank depositors to equity investors.
One Thing Coverage Usually Gets Wrong About FPI Selling
When FPIs sell Indian stocks in the secondary market, most coverage treats it as foreigners rejecting the India story. The 25-month data tells a more nuanced picture.
FPIs bought in 7 of the 25 months. In October 2025, they were net sellers of just Rs 2,347 crore in existing stocks, a minimal exit, while simultaneously deploying Rs 10,708 crore into Indian IPOs. They were rotating, not fleeing. The full dataset also shows that when global conditions stabilised, June 2025, May 2025, April and March 2025, FPIs came back quickly. Foreign capital is tactical and responsive to macro conditions. It's not a verdict on India's long-term story.
For deeper analysis of FPI sector rotation and how foreign investors shift money between sectors, watch our detailed videos on YouTube at https://www.youtube.com/@Adroitfinancial11.
When Will FPIs Come Back Sustainably? Three Things to Watch
Foreign capital always returns after a sell-off. The April 2026 data illustrates this precisely: even while FPIs were still selling Rs 70,135 crore, the Nifty gained 7.5% because the macro triggers started moving in the right direction. When short positions unwind, the recovery can be fast and vertical.
What This All Means for You
FII and DII flows are not abstract market data. They are the actual buying and selling that determine what happens to your portfolio every single day. When you see your mutual fund NAV drop by Rs 200 per unit, when your SIP monthly statement shows units bought at lower prices, when WhatsApp groups fill up with 'should I stop my SIP?' messages, that is the FPI-DII dynamic playing out in real time.
Understanding it doesn't make market falls comfortable. But it does change what you do with that discomfort. In March 2026, knowing that DIIs were buying a record Rs 1.43 lakh crore even as FPIs sold a record Rs 1.22 lakh crore would have told you something important: this was sentiment-driven, not a structural collapse. The domestic financial system had not lost faith. The investor who kept their SIP running bought units at March's lower NAV and benefited from April's 7.5% recovery.Over 25 months from April 2024 to April 2026, FPIs have been net sellers of Rs 7.84 lakh crore. DIIs have been net buyers of Rs 14.98 lakh crore. The Nifty 50 is higher today than it was 25 months ago. That is the DII cushion in action, not theory, but actual market data.
When FIIs exit and DIIs hold the line, it isn't panic versus patience. It's India's market telling you that the floor is now domestic, and that floor gets stronger with every SIP that runs on the 5th of the month.
Sources & References
- NSDL / AMFI : FII vs DII vs Nifty Monthly Data, April 2024 to April 2026
All monthly FPI and DII flows, Nifty closing levels, and percentage changes have been taken from here. April 2026 numbers reflect the final month-end data.
- AMFI : Monthly SIP Data, March 2026 | amfiindia.com
SIP contributions stood at Rs 32,087 crore (up 7.5% month-on-month), with 9.72 crore active SIP accounts. SIP AUM crossed Rs 15.11 lakh crore, making up 20.5% of the mutual fund industry, with 61 straight months of positive equity inflows.
- IBEF : Growing Power of India’s DIIs in Indian Equity Markets, January 2026 | ibef.org
This report highlights DII ownership at 19.2% versus FPI ownership at 18.5% as of June 2025. Note: The ₹11.4 lakh crore DII net buying figure mentioned in that report was as of early 2026. The updated 25-month aggregates used in this article (up to April 2026) are based on final NSDL data.
- Economic Survey 2025-26 (citing RBI data)
Equity and mutual fund investments as a share of household financial savings rose from just 2% in FY12 to 15.2% in FY25, while the share of bank deposits declined from 58% to around 35%.
- Economic Survey 2026 : Demat Account Data
Demat accounts surged from 4 crore in 2020 to 21.6 crore by December 2025, with more than 56% of new investors being under 30 years of age.
- Business Standard : FPI Derivatives Summary, March 2026
India VIX spiked to a 4-year high of 27.89, and Bank Nifty fell 16.94% compared to Nifty’s 11.3% decline.
- AMFI : DII Calendar Year 2025 Flows
Domestic institutions invested a record Rs 6 lakh crore in equities during CY2025, while FPIs recorded an outflow of Rs 2.03 lakh crore. DIIs effectively absorbed nearly 3 times the foreign selling that year.
- NSE: India Ownership Tracker Reports (Q3 FY25, Q1 FY26)
FPI ownership at approximately 16.9% in NSE-listed companies by early 2026 (15-year low); DII ownership at 19.24% in March 2026 quarter, up from 18.72% in December 2025.
Disclaimer:
Adroit Financial Services Private Limited (hereinafter referred to as "Adroit"), Registered Address: F-912, Titenium City Center, Nr. Sachin Towers, 100 Feet Ring Road, Anand Nagar, Manekbag, Ahmedabad, Ahmadabad City, Gujarat, India, 380015.
Correspondence Address: 401-402, Fourth Floor, Angel Mega Mall, Plot No. CK1, Kaushambi, Ghaziabad, Uttar Pradesh, India, 201010.
Registration Numbers: CIN: U74899GJ1994PTC128736 | SEBI Registration Numbers: NSE, BSE, MCX & NCDEX: INZ000173137 |Member Code: BSE-3034, NSE- 08538, MCX- 56790 & NCDEX- 01302 | DP- NSDL/CDSL- IN-DP-551-2021 | Research Analyst: INH100003084 | Portfolio Management Services (PMS): INP000005349 | Mutual Fund: ARN- 30091.
Standard Disclaimer: Investments in the securities market are subject to market risk, read all the related documents carefully before investing. This is for educational purposes and does not provide any advice/tips on Investment or recommend buying and selling of any stock. Adroit or its associates has not been debarred/ suspended by SEBI or any other regulatory authority for accessing/ dealing in securities Market. Adroit or its associates/analyst has not received any compensation/ managed or co-managed public offering of securities of the company covered by Analyst during the past twelve months. This document is solely for the personal information of the recipient, and must not be singularly used as the basis of any investment decision. Nothing in this document should be construed as investment or financial advice. Each recipient of this document should make such investigations as they deem necessary to arrive at an independent evaluation of an investment in the securities of the companies referred to in this document (including the merits and risks involved), and should consult their own advisors to determine the merits and risks of such an investment. The information in this document has been printed on the basis of publicly available information, internal data and other reliable sources believed to be true, but we do not represent that it is accurate or complete and it should not be relied on as such, as this document is for general guidance only. Neither Adroit, nor its directors, employees or affiliates shall be liable for any loss or damage that may arise from or in connection with the use of this information. Adroit Financial Services Private Limited has not independently verified all the information contained within this document. Accordingly, we cannot testify, nor make any representation or warranty, express or implied, to the accuracy, contents or data contained within this document.
Margin Trading Funding (MTF) is subject to provisions of SEBI circular
CIR/MRD/DP/54/2017 dated June 13,2017 and the terms and conditions mentioned in the rights and obligations statement issued by Adroit Financial Services Private Limited.
Read More On: www.adroitfinancial.com